Visualization of flow in the living body
Improvement of Spatio-Temporal Resolution and Quantitative Properties of Ultrasonic FLow Imaging
When an object moving inside the body, such as blood, is measured using ultrasound, the Doppler effect causes a frequency change in accordance with its speed. This change in frequency is visualized as a color Doppler image, whihc is one of the strengths of medical ultrasound imaging. By developing this technology, our laboray is conducting reserach on imaging the blood flow inside the heart, microvessels in the periphery, urine flow, and various other "flows" in the body more clcearly and in detail. For example, we have developed a technique called Echo-dynamograph (EDG) to visualize the vortex flow and jet flow inside the heart, and to use quantitative analysis of the flow for more detailed evaluation of cardiac motion.
Principle of EchoDynamography
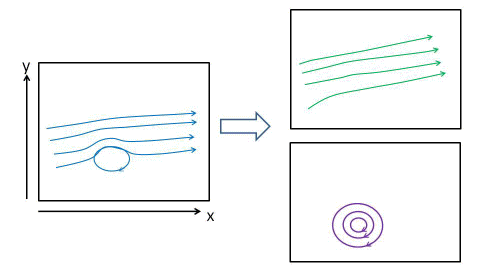
The Doppler effect refers to the fact that the frequency of sound waves from a source that is coming toward the observer increases, while the frequency from the a source that is moving away decreases. In clinical ultrasound, this Doppler effect is used to detect whether the blood flow is moving away from or closer to the probe. However, blood flow in the heart does not necessarily flow inly in a direction parallel to that of the ultrasound. By applying the laws of fluid dynamics, we have started to develop EchoDynamograhy to visualize the blood flow in the heart and blood vessels. As shown in the Figure on the left, the components of the flow can generally be separated into direct current and eddy current components.

Flow distance function
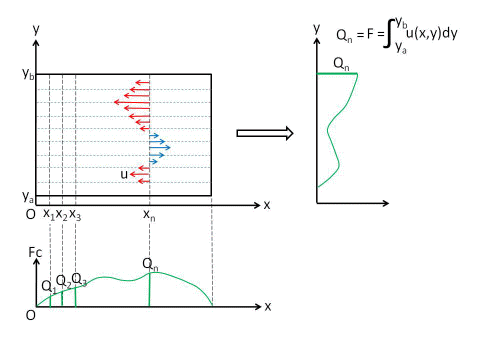
From the velocity distribution at the distance xn from the ultrasound probe, we can draw the flow function at xn. By consdering such a flow, EchoDynamogrgaphy can estimate the flow in the three-dimensional direction from the measurment of the flow in the two-dimensional plane. EchoDynamography takes into account this kind od flow to infer three-dimensional flow from two-dimensional planar flow measurement.

An Example of EchoDynamography
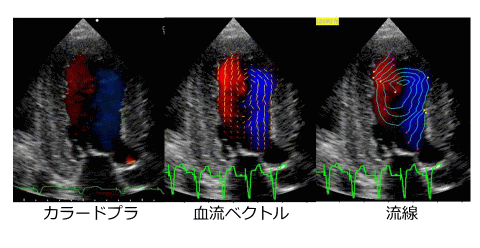
The figure on the right shows, from left to right, a normal color Ddoppler image, a flow vector image using EchoDynamography, and a streamline image as well. Experienced sonographers can visualize the flow of blood in the heart just by looking at a color Doppler movie image, but usually the direction and size of the blood flow can only be determined by looking at these EchoDynamography images. It is also possible to quantify the vortices and so on.

Extension to 3D flow
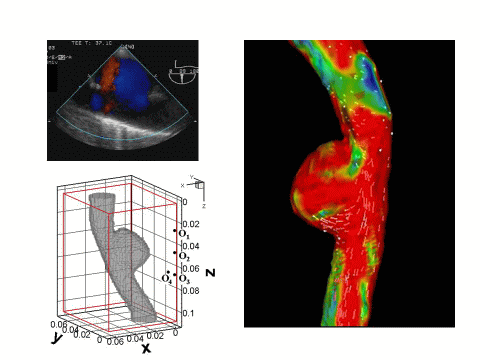
In addition to EchoDynamography, which is based on two-dimensional color Doppler images of ultrasound, we are also expanding to three-dimensional flow analysis by acquiring three-dimensional data by transesophageal echocardiography and reconstructing it in virtual space. In collaboration with Dr. Toshiyuki Hayase, Director of the Institute of Fluid Science at Tohoku University, and Dr. Kenichi Funamoto, we are currently working on a reseearch project to integrate ultraosund data with 3D blood flow simulation in an aneurysm model to achieve the best possible match between simulation and actual measurement. In addition, we have started blood flow analysis using MRI, and are beginning to research diagnostic methods that combine the high temporal resolution of ultrasound with the data stability of MRI.


