Ultrasound Signal Processing
Parametric Imaging: From mophological observation to histological diagnosis
Ultrasound images typically show the intensity of ultrasound reflection in grayscale, displaying information about the shape and size of the tissue. Parameteric imaging is a method of diagnosing histological properties by imaging parameters such as frequency information and minute movements of blood vessles due to the load of blood pressure, as well as the strenth of ultrasonic reflection. Applying this technique to intravascular ultrasound, parameters such as integrated backscatter (IB), tissue strain, virtual Histology, two-dimensional tissue velocity, and attenuation imaging enable automatic diagnosis of atherosclerotic tissue.
Analysis of intravascular ultrasound (IVUS) signals
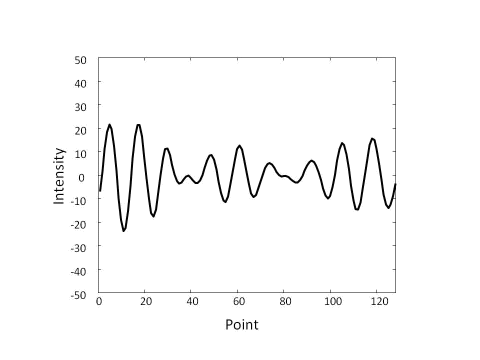
Various signal and image processing is performed inside the ultrasound system used for echocardiography and other applications. Although it is difficult to access these original data, it used to be relatively easy to access the original signals in intravascular ultraosund (IVUS) systems. The figure on the right shows a 128-point cutout of the original signal. In practice, the echo image is created by taking the absolute value of this signal and having its envelope drawn. Because of this easy access to the original signal, we developed a series of parametric imaging techniques, which we named parametric IVUS.
Time domain signal and frequency domain signal
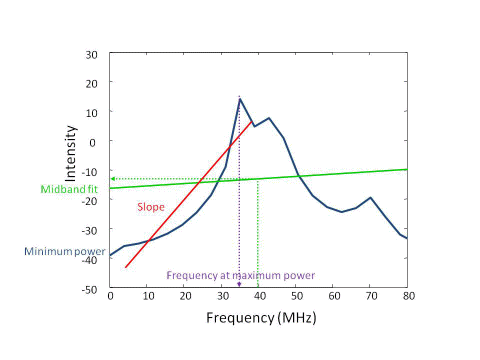
The right figure shows the above time-domain signal converted to a frequency-domain representation using Auto Regression Method. In this example, a relatively smooth frequency spectrum is derived by approximating the 14th order equation. This spectrum is automatically classified by a computer, but although computers are good at handling numbers at high speed, thay are not good at recognizing images themselves. Therefore, in this research, the spectra are classified into three categories Midband fit, Minimum power, Frequency at max power, and Slope, as represented by the figure on the right, and used for classification.
Application of Parametric IVUS
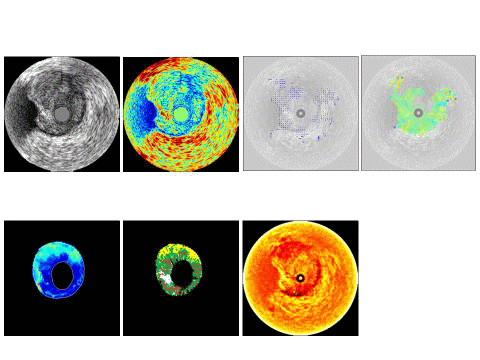
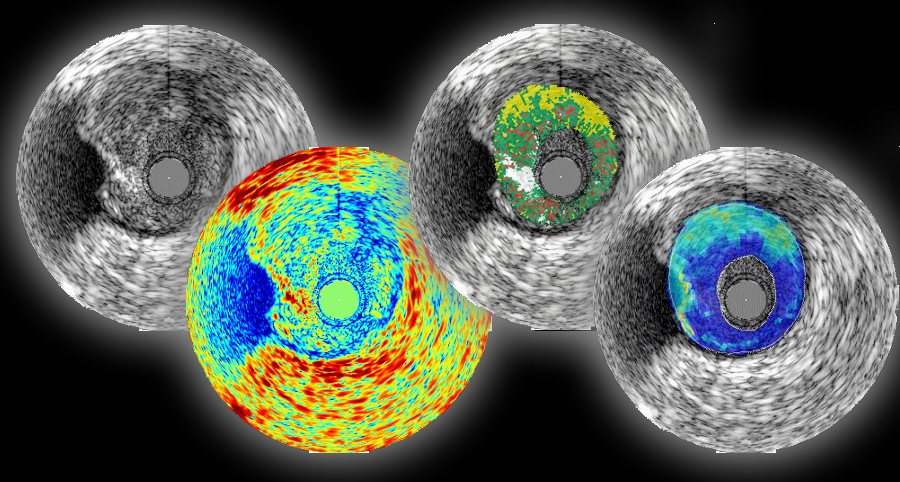
The figure on the left shows normal IVUS, Integrated backscatter(IB)2D tissue vector, 2D tissue strain, Virtual Histology(installed in Volcano's equipment, and Attenuation imaging. In normal IVUS and IB images, the tissue in the 12 o'clock direction looks uniform, but in tissue strain images, the outside is softer than the inside. This area was classified as fat-rich tissue in VH. This area is also shown to have low Attenuation. As can be seen from this example, parametric IVUS enables tissue diagnosis by analyzing atherosclerotic tissue in multifaceted and quantitative manner. We have brought such accurate diagnosis to clinical practice and proved its effectiveness in device selection during coronary intervention.